
According to the Declaration on Research Assessment (DORA), we believe that the high quality of the research and of its description (i.e. the high quality of the papers’ content) is more relevant than indexing. However, since the carrier of young scholars might depend on journal indexing, here below you can find information on IxD&A indexing and metrics.
IxD&A journal indexing
• Scopus – since Winter 2008 (Issue N. 3-4)
• Emerging Sources Citation Index – Web of Science – since the beginning of 2015 (Issue N. 24)
• DOAJ (Directory of Open Access Journal) and ROAD (Registry of Open Access Scholarly Resources)
• GoogleScholar and DBLP -> link
• Norwegian register of scientific journals, series, and publishers -> link
• Danish Bibliometriske Forskningsindikator (BFI)
IxD&A is also listed in the:
• dblp (computer science bibliography) -> link
• EdTech Journals (a listing of journals in the area of educational technology, instructional design, and distance learning) -> link
Domains of reference of IxD&A Journal
Design (as a subdomain of Architecture) — Media Technology, Human-Computer Interaction and Computer Science Application — Social Science — Education.
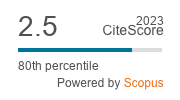
Metrics
(for an overview and a brief description see link)
CiteScore 2024
Design (/Architecture): Q1 (77th)
Multidisciplinary: Q2 (71st) – Media Technology: Q2 (61st) – Education: Q2 (56th)
SJR (2025) = 0.354
corresponding to the following rankings for IxD&A domains of reference:
• Design (/Architecture): Q1 (77th percentile) – 48th in the World (19th among the open access ones, 5th among the open access + diamond ones; 2nd among OA+diamond journals indexed in WoS) • Multidisciplinary: Q2 (69th percentile) – 72th in the World (54th among the open access ones, 12th among the open access + diamond ones; 6th among OA+diamond journals indexed in WoS)
• Media Technology: Q2 (71st percentile) – 26th in the World (4th among the open access ones, 3rd among the open access + diamond ones; 1st among OA+diamond journals indexed in WoS)
• Social Science (miscellaneous): Q2 (55th percentile) – 370th in the World (110th among the open access ones, 41th among the open access + diamond ones; 13th among OA+diamond journals indexed in WoS)
• Computer Science Application: Q3 (46th percentile) – 551th in the World (191th among the open access ones, 42th among the open access + diamond ones; 23rd among OA+diamond journals indexed in WoS)
• Education: Q3 (49th percentile) – 863th in the World (218th among the open access ones, 112th among the open access + diamond ones; 58th among OA+diamond journals indexed in WoS)
• Human-Computer Interaction: Q3 (41th percentile) – 120th in the World (45th among the open access ones, 8th among the open access + diamond ones; 2nd among OA+diamond journals indexed in WoS)
SJR (2021) IF: 1.639 (2 years) – 1.533 (3 years) – 1.380 (4 years)
SNIP (2024) = 0.45; IPP = 1.21
h-index = 22
Publishing figures 2023
• overall acceptance rate of regular papers: 20%
• overall acceptance rate for special issues & focus sessions: almost 50%
• issues -> 4 (4 special issues)
• published papers -> 34 (8 regular papers – 2 stimulated papers)
• authors -> 111 (+ 17 guest editors)
• authors’ provenance -> 20 countries (4 continents)
Australia 3
Brasil 8
Canada 2
Colombia 5
Czechoslovakia 1
Denmark 5
Estonia 2
France 1
Germany 9
Greece 1
Italy 9
Norway 7
Portugal 6
Saudi Arabia 2
Spain 11
Sweden 11
The Netherland 5
Turkey 7
United Kingdom 8
United States 7
Publishing figures 2022
• overall acceptance rate of regular papers: 20%
• overall acceptance rate for special issues & focus sessions: almost 50%
• issues -> 4 (3 special issues + 2 focus sections)
• published papers -> 44
• authors -> 138 (+ 17 guest editors)
• authors’ provenance -> 25 countries (4 continents)
Austria 1
Brazil 17
Canada 7
Denmark 2
Ecuador 1
Finland 4
France 4
Germany 4
Greece 2
Italy 11
Malaysia 5
Mexico 3
Namibia 2
Portugal 26
Romania 3
Singapore 1
South Africa 2
Spain 18
Sri Lanka 3
Sweden 3
Taiwan 3
The Netherland 6
Turkey 5
United Kingdom 1
United States 5
Publishing figures 2021
(older figures can be found here)
• overall acceptance rate of regular papers: less than 10%
• overall acceptance rate for special issues & focus sessions: almost 50%
• issues -> 4 (3 special issues + 2 focus sections)
• published papers -> 33
• authors -> 108 (+ 17 guest editors)
• authors’ provenance -> 22 countries (4 continents)
Argentina 8
Australia 15
Austria 4
Canada 5
Colombia 8
Denmark 5
Finland 16
Germany 10
India 2
Indonesia 1
Italy 3
Korea 3
Mexico 4
New Zealand 1
Norway 2
Portugal 3
Spain 2
Sweden 7
The Netherland 5
Turkey 3
United Kingdom 3
United States 2
The 10 most cited papers so far (May 2024, 5th):
1) Michael Sailer, Jan Hense, Heinz Mandl, Markus Klevers
Psychological Perspectives on Motivation through Gamification, Issue N. 19, pp. 28 – 37, 2014
abstract, download (https://doi.org/10.55612/s-5002-019-002)
Percentile: 98th; FWCI: 6,71
2) Carlo Giovannella, Marcello Passarelli, Donatella Persico
The Effects of the Covid-19 Pandemic on Italian Learning Ecosystems: the School Teachers’ Perspective at the steady state, Issue N. 45, pp. 264 – 286, 2020
abstract, download (https://doi.org/10.55612/s-5002-045-012)
Percentile: 97th; FWCI: 5,49
2) Ann Light & Clodagh Miskelly
Sharing Economy vs Sharing Cultures? Designing for social, economic and environmental good, Issue N. 24, pp. 49 – 62, 2015
abstract, download (https://doi.org/10.55612/s-5002-024-003)
Percentile: 95th; FWCI: 3,65
4) Giannis Altanis, Michalis Boloudakis, Symeon Retalis, Nikos Nikou
Children with Motor Impairments Play a Kinect Learning Game: First Findings from a Pilot Case in an Authentic Classroom Environment, Issue N. 19, pp. 91 – 104, 2014
abstract, download (https://doi.org/10.55612/s-5002-019-007)
Percentile: 94th; FWCI: 3,47
5) Bart Rienties, Quan Nguyen, Wayne Holmes, Katharine Reedy
A review of ten years of implementation and research in aligning learning design with learning analytics at the Open University UK, Issue N. 33, pp. 134 – 154, 2017
abstract, download (https://doi.org/10.55612/s-5002-033-007)
Percentile: 95th; FWCI: 3,83
6) Airi Lampinen, Kai Huotari, Coye Cheshire
Challenges to Participation in the Sharing Economy: The Case of Local Online Peer-to-Peer Exchange in a Single Parents’ Network, Issue N. 24, pp. 16 – 32, 2015
abstract, download (https://doi.org/10.55612/s-5002-024-001)
Percentile: 93th; FWCI: 3,04
7) Marc Busch, Elke Mattheiss, Wolfgang Hochleitner, Christina Hochleitner, Michael Lankes, Peter Fröhlich, Rita Orji and Manfred Tscheligi
Using player type models for personalized game design – An empirical investigation, Issue N. 28, pp. 145 – 163, 2016
abstract, download (https://doi.org/10.55612/s-5002-028-008)
Percentile: 90th; FWCI: 2,44
8) Maja van der Velden
Digitalisation and the UN Sustainable Development Goals: What role for design, Issue N. 37, pp. 160 – 174, 2018
abstract, download (https://doi.org/10.55612/s-5002-037-008)
Percentile: 87th; FWCI: 2,00
9) Giannis Altanis, Michalis Boloudakis, Symeon Retalis, Nikos Nikou
Troubling Futures: Can Participatory Design Research provide a Constitutive Anthropology for the 21st Century?, Issue N. 26, pp. 81 – 94, 2015
abstract, download (https://doi.org/10.55612/s-5002-026-005)
Percentile: 89th; FWCI: 2,27
10) Eva Durall, Merja Bauters, Iida Hietala, Teemu Leinonen, Evangelos Kapros
Co-creation and co-design in technology-enhanced learning: Innovating science learning outside the classroom, Issue N. 42, pp. 222 – 226, 2019
abstract, download (https://doi.org/10.55612/s-5002-042-010)
Percentile: 87th; FWCI: 2,06
10) Martin Tomitsch, Joel Fredericks, Dan Vo, Jessica Frawley, Marcus Foth
Non-human Personas: Including Nature in the Participatory Design of Smart Cities, Issue N. 50, pp. 102 – 130, 2021
abstract, download (https://doi.org/10.55612/s-5002-050-007)
Percentile: 93th; FWCI: 3,14
Reading Stats
We started to update the reading stats in April 2023
(older stats can be found here)
In the month of April 2024 (one month) IxD&A website has been visited by scholars (more than 52 new users per day) from 92 countries (located on all continents); about 128 pages visualizations (and 355 events) per day according to Google Analytics, almost 140 resolved DOIs per day according to Crossref.
The 25 most active countries in the domains of interest of the journal are (in square brackets the variation of the position in the 2023-24 ranking with respect to the year 2019):
1) United States [-]
2) United Kingdom [-]
3) Spain [+6]
4) Netherlands [-]
5) China [+3]
6) Australia [-1]
7) Italy [-4]
8) Germany [-2]
9) Brazil [+7]
10) Peru [+13]
11) Finland [-4]
12) Turkey [-2]
13) Norway [-]
14) Austria [+4]
15) Sweden [-4]
16) Canada [-1]
17) France [-5]
18) India [-1]
19) Mexico [+6]
20) Greece [n.a.]
21) Indonesia [-2]
22) Portugal [-8]
23) Philippines [-1]
24) Japan [n.a.]
25) Colombia [-4]
In the period April 2023-March 2024 (one year) IxD&A website has been visited by scholars (more than 37 new users per day) from 135 countries (located on all continents); about 115 pages visualizations (and 304 events) per day according to Google Analytics, almost 105 resolved DOIs per day according to Crossref
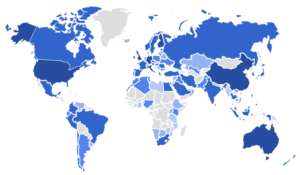
The 25 most active countries in the domains of interest of the journal are (in square brackets the variation of the position in the 2023-24 ranking with respect to the year 2019):
1) United States [-]
2) United Kingdom [+1]
3) Italy [-1]
4) Netherlands [+1]
5) Australia [+3]
6) Germany [-2]
7) Finland [+6]
8) China [n.a.]
9) Spain [-]
10) Turkey [+10]
11) Sweden [-4]
12) France [+5]
13) Norway [+1]
14) Portugal [n.a.]
15) Canada [-5]
16) Brazil [-1]
17) India [-12]
18) Austria [-7]
19) Indonesia [n.a]
20) Malaysia [n.a.]
21) Colombia [n.a.]
22) Philippines [n.a.]
23) Peru [n.a.]
24) South Korea [-14]
25) Mexico [n.a.]